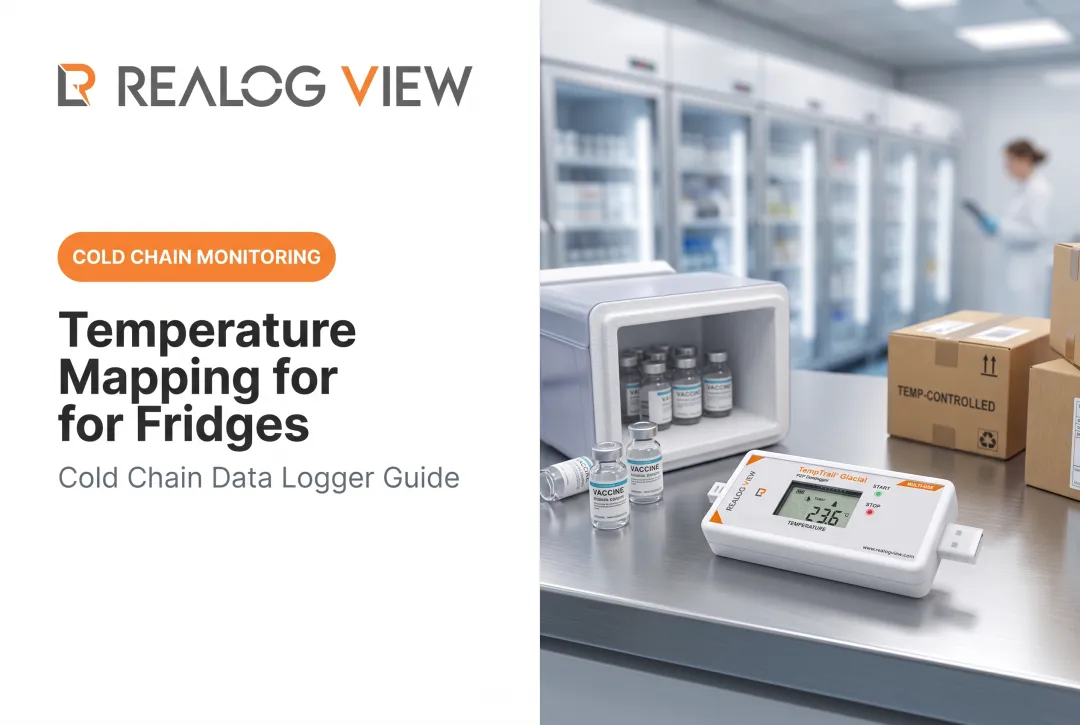
This guide is written for pharmaceutical, cold chain, food, and industrial storage teams managing GxP or FDA compliance. Temperature excursions don't just trigger paperwork; they can destroy vaccines, biologics, and perishable inventory before anyone notices.
Mapping shows up constantly in SOPs and audit checklists, yet the mechanics behind it are rarely explained well. This article breaks down how the process works, what influences the results, and when it actually applies to your facility.
TL;DR
- Mapping finds hot and cold spots with temporary loggers before permanent monitoring installs
- GxP-regulated industries need it to satisfy FDA, WHO, and EU GDP/GMP expectations
- The workflow spans protocol development, logger deployment, data collection, and reporting
- Load conditions, equipment reliability, and mapping frequency drive outcome variability
What Is Temperature Mapping for Storage?
Temperature mapping is a structured, temporary study that measures how temperature (and sometimes humidity) behaves throughout a storage space, whether that's a refrigerator, freezer, warehouse, or cold room. The goal is straightforward: document proof that every point in the space stays within acceptance criteria.
This proof must hold even during worst-case scenarios, such as:
- Door left open longer than the specified time limit
- Power failure or utility interruption
- HVAC or compressor cycling during recovery
- Seasonal extremes affecting ambient conditions
It's often confused with two related activities, so here's how they differ:
| Concept | Duration | Sensor Placement | Purpose |
|---|---|---|---|
| Temperature Mapping | Temporary (days to weeks) | Many sensors, grid pattern | Find hot/cold spots, validate uniformity |
| Temperature Monitoring | Permanent, ongoing | Few sensors, targeted locations | Continuous compliance tracking |
| Qualification (IQ/OQ/PQ) | Project-based | Varies by phase | Prove equipment functions as intended overall |
Mapping isn't the same as qualification, either. Qualification is the broader proof that a storage unit or facility works as designed. Mapping is one specific study inside that larger process, focused purely on spatial temperature distribution.
Here's the part that trips up a lot of teams: mapping results directly determine where permanent monitoring sensors get placed afterward. If your mapping study identifies a warm zone near a door seal, that's where your ongoing monitoring sensor needs to sit, not wherever happened to be convenient during installation.
Why Temperature Mapping Is Essential for Storage
The financial stakes are significant. Pharmaceutical cold chain failures cost the industry an estimated $35 billion annually, according to IQVIA Institute research covered by Pharmaceutical Commerce in 2023. That figure covers wasted product, recalls, and lost trust when storage conditions fail silently.
Storage environments create specific challenges mapping is built to address:
- Uniformity across large or irregularly shaped spaces where airflow varies by shelf or zone
- Tight tolerances for sensitive biologics and vaccines that degrade outside narrow ranges
- Consistency despite seasonal shifts, HVAC cycling, and daily operational traffic
Skip mapping, and the consequences show up fast:
- Hot and cold spots go undetected across the storage space
- Product quality degrades with no visible warning
- Audits fail for lack of documented validation evidence
Mapping sits at the intersection of regulation and best practice. FDA cGMP (21 CFR 211.142) requires appropriate storage conditions without naming mapping directly. WHO TRS 961 Annex 9, EU GDP guidelines, and USP <1079.4>, however, all expect mapping studies as the evidence that proves compliance.
Even well-built equipment isn't immune to internal variation. A peer-reviewed study that mapped ultra-low-temperature freezers over 72 hours found mean shelf temperatures ranging from -79.1°C to -83.17°C, a spread of roughly 4 degrees between shelves.
During door-opening tests, front sensors swung as much as 26 degrees. Good equipment reduces risk, but it doesn't eliminate the need to verify.

How Temperature Mapping Works (Conceptual Flow)
At a high level, teams position calibrated data loggers in a grid pattern throughout the storage space. They then record temperature continuously across both normal operation and stress-test conditions over a set duration.
The process depends on a few core inputs:
- An approved mapping protocol
- Calibrated, traceable loggers
- Defined acceptance criteria
- Both empty and fully loaded configurations
During the study, loggers capture data through door-opening tests, simulated power failures, and standard operating conditions. Duration typically runs anywhere from 24 hours for a stable cold room to two weeks for a large ambient warehouse.
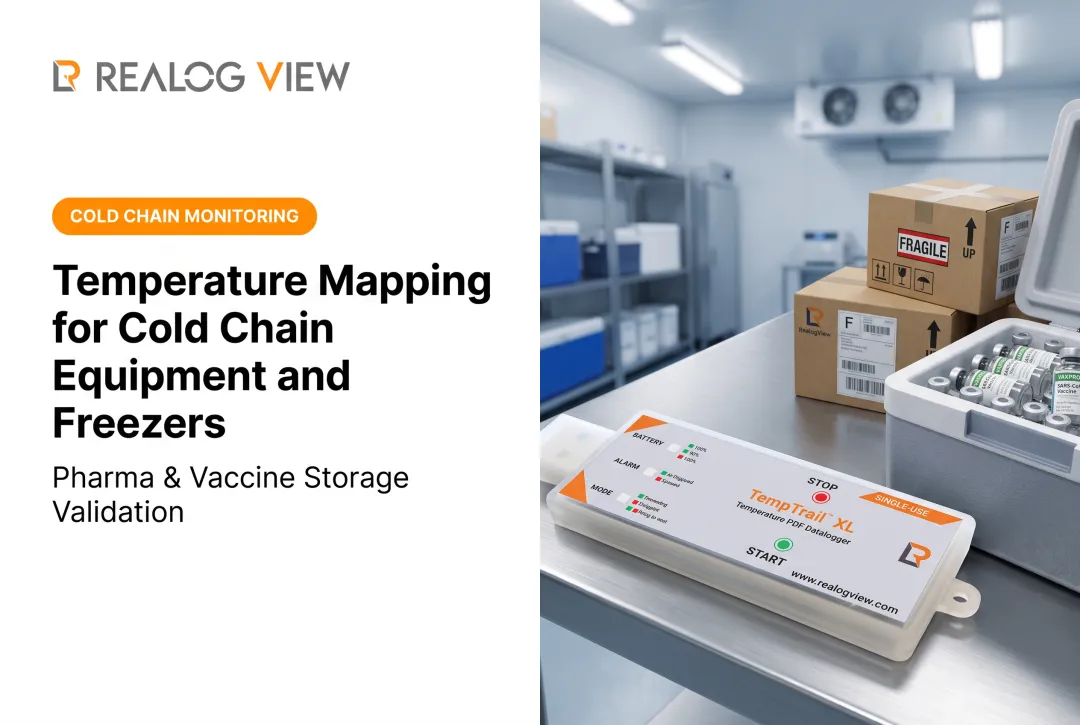
Once the study duration is set, data integrity matters just as much as data collection. FDA 21 CFR Part 11 compliant loggers, like Realog View's TempTrail line, generate tamper-proof PDF and CSV reports automatically over USB, with no external software required.
That removes a common failure point where mapping data gets questioned during an audit simply because the chain of custody wasn't clean.
The end result is a mapping report that identifies hot and cold zones and confirms acceptance criteria compliance, along with clear recommendations for exactly where permanent monitoring sensors should go.
Step 1: Develop the Mapping Protocol
Before placing any logger, the protocol defines scope, acceptance criteria, risk assessment, and a logger placement strategy. This document is what auditors will ask for first, so it needs to justify every decision made later in the study.
Step 2: Execute the Study and Collect Data
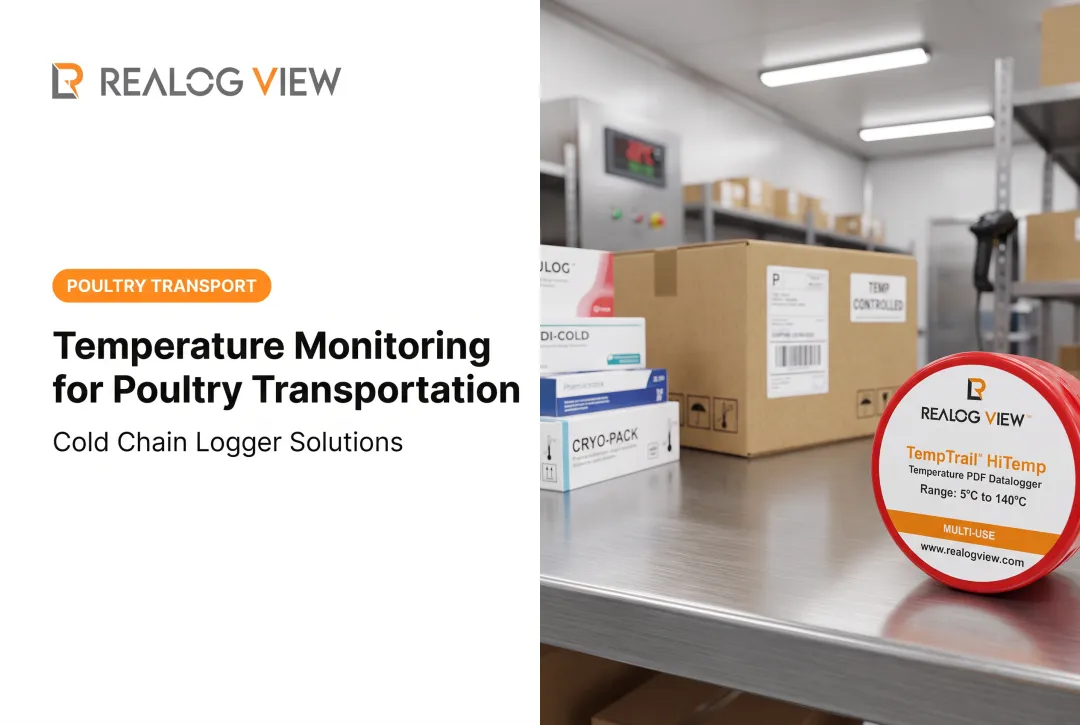
Teams deploy loggers under both empty and loaded conditions, plus stress scenarios like open doors and power loss. Sealed, IP67/IP68-rated loggers matter here. Realog View's TempTrail Glacial, for instance, holds an IP67 rating down to -85°C, while the TempTrail HiTemp is IP68-rated and fully submersible for +5°C to +140°C environments. Neither moisture nor extreme cold should compromise a reading mid-study.
Step 3: Analyze Data and Generate the Report
Once collection wraps, analysts review the data for deviations, hot/cold zones, and recovery times after stress events. The final report should be audit-ready, with clear recommendations for where permanent monitoring should live going forward.

Where and When Temperature Mapping Is Applied
Mapping applies to a wide range of storage equipment and spaces:
- Refrigerators and freezers
- ULT and cryogenic freezers
- Incubators and stability chambers
- Autoclaves
- Warehouses and cold rooms
- Transport containers
Temperature mapping occurs at specific lifecycle points, not just once:
- New equipment qualification: performed before a unit goes into service
- Post-repair — after maintenance that could affect thermal performance
- Post-relocation, whenever a unit or room changes location
- Periodic re-qualification — on a schedule tied to risk
- Seasonal studies: separate winter and summer mapping for warehouses affected by ambient swings
Common triggers include a new equipment purchase, a major facility change, drift detected in routine monitoring data, or findings from a regulatory audit. Mapping is both recurring and condition-based, occurring on a periodic schedule as well as whenever something changes that could shift thermal behavior.
Key Factors, Common Mistakes, and When Mapping May Not Be Needed
Key Factors That Affect Mapping Outcomes
Several variables shape whether a mapping study reflects real-world conditions:
- Loading conditions: empty versus full storage changes airflow and thermal mass, directly affecting worst-case results
- External conditions: ambient room temperature, seasonal shifts, and HVAC performance all influence internal stability
- Equipment dependencies: logger accuracy and calibration status matter most in extreme ranges. Realog View's cryo and autoclave logger lines, for instance, cover -85°C to +140°C for these exact conditions.
- Regulatory constraints: FDA 21 CFR Part 11 traceability requirements dictate how data must be captured, stored, and reported
Common Issues and Misconceptions
A few mistakes come up repeatedly during audits:
- Treating mapping and monitoring as interchangeable. Mapping is temporary and exhaustive. Monitoring is permanent and targeted at the spots mapping identified.
- Set-and-forget thinking. Mapping isn't a one-time checkbox. It's an ongoing, risk-reviewed process tied to equipment and facility changes.
- Cutting corners on loggers or stress tests. Using too few sensors, or skipping door-opening and power-failure tests, produces results that look valid but aren't.
When Temperature Mapping May Not Be Appropriate
Full mapping studies aren't always necessary:
- Low-risk, non-critical storage with negligible product sensitivity may not need a full study
- If a documented risk assessment shows no equipment or environmental changes, a review may substitute for full re-mapping
- Watch for mapping done "by default," such as re-mapping unchanged equipment every year with no triggering event or risk basis behind it
Frequently Asked Questions
How often should temperature mapping be performed?
Facilities typically map units before first use, then repeat mapping every 1-3 years or after major changes. Continuous mapping frameworks can reduce how often periodic re-studies are needed.
What is the difference between temperature mapping and temperature monitoring?
Mapping is a temporary, comprehensive study using many sensors to find hot and cold spots. Monitoring uses fewer, permanently placed loggers for ongoing tracking based on what mapping found.
How many data loggers are needed for a mapping study?
Sensor count depends on space size and complexity. WHO guidelines recommend a logger every 5-10 meters in a grid pattern, adjusted through a risk-based approach for layout and airflow.
What happens if a temperature mapping study fails?
A failed study signals inconsistent temperature control. It requires corrective action, such as HVAC adjustments or equipment changes, followed by a re-mapping study before the unit can be trusted for storage.
Is temperature mapping required by the FDA?
The FDA has no standalone mapping regulation. However, cGMP and GDP requirements for validated storage conditions make mapping a practical necessity as compliance evidence.
What is the difference between temperature mapping and validation/qualification?
Qualification confirms that equipment installs correctly and performs as intended overall. Mapping is one specific study within that process, focused purely on spatial temperature distribution.