The stakes are substantial. FDA data from FY2022 documented 912 drug recalls from 166 facilities, including 130 recalls attributed to temperature abuse and 100 recalls tied to products stored outside appropriate temperature conditions. Many of these failures involved warehouse storage breakdowns—precisely the scenarios temperature mapping is designed to prevent.
Key Takeaways
- Temperature mapping finds warehouse hot and cold spots with calibrated sensors to verify GDP compliance before storage
- WHO, PIC/S, and EU GDP rules require pre-use mapping and repeats after facility, HVAC, or equipment changes
- Studies run 7–14 days with 3D sensor grids at floor, mid-height, and ceiling to capture worst-case conditions
- Results guide permanent monitoring, cut product-loss risk, and document facility qualification for inspections
What Is Temperature Mapping for GDP Pharmaceutical Warehouses?
Temperature mapping, also called thermal mapping or a temperature distribution study, is a qualification process that shows how temperature behaves across an entire warehouse. Multiple calibrated temperature data loggers placed throughout the facility record three-dimensional temperature distribution over time.
A single wall-mounted sensor only monitors one location. Mapping builds a full spatial picture of temperature performance across the storage volume.
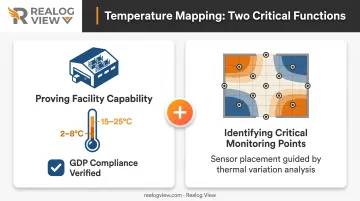
The process serves two critical purposes:
- Proving facility capability: Shows every storage location holds labeled conditions (typically 2-8°C refrigerated or 15-25°C ambient) under GDP rules
- Identifying critical monitoring points: Finds hot spots and cold spots where permanent sensors must sit to catch future excursions
Regulatory Context
WHO Technical Supplement 8 to TRS 961, PIC/S GDP Guide PE 011-1, and EU GDP Guidelines 2013/C 68/01 all mandate temperature mapping as part of facility qualification.
US rules under 21 CFR 205.50 require labeled storage conditions but do not name mapping outright. Even so, mapping remains the industry-standard way to prove compliance.
Initial Mapping vs. Re-Mapping
- Initial mapping: Done before a new facility or storage area is released for product; sets the baseline thermal profile
- Re-mapping: Required after HVAC changes, layout shifts, major equipment failures, or on a risk-based interval (WHO cites every three years as one example, not a fixed rule)
The final report produces a temperature profile of the zones most prone to excursions. Those zones become the permanent real-time monitoring points.
Why Temperature Mapping Is Critical for Pharmaceutical Warehouses
Temperature mapping directly protects product quality, regulatory standing, and financial stability. Skipping or improperly executing studies creates blind spots with serious consequences:
- Undetected product degradation: Medications in unmapped hot spots can lose potency with no visible signs. Heat accelerates chemical degradation exponentially (Arrhenius kinetics), so brief exposure can leave batches subpotent while appearing normal.
- Regulatory citations and enforcement: FDA, EMA, and other authorities inspect mapping documentation during GDP audits. FDA's January 2023 warning letter to Atlantic Management Resources cited failure to store products under appropriate temperature conditions.
- Financial losses from failed batches: Destroyed inventory, recalls, and halted distribution from temperature deviations cost manufacturers and distributors substantial sums.
- Failed audits and certification issues: Missing or inadequate mapping documentation is a common GDP finding and can block facility certification or product release.
- Inefficient monitoring systems: Without mapping data, teams either over-monitor and waste sensors or under-monitor and miss worst-case locations.
- Inability to investigate deviations: When alarms fire, lack of baseline mapping data makes root-cause analysis difficult and corrective actions speculative.
How Temperature Mapping Works – Step-by-Step Process
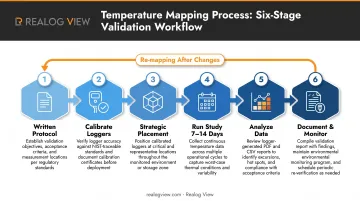
Temperature mapping follows six practical stages aligned with GDP requirements. The most common execution mistakes include:
- Using uncalibrated sensors
- Running the study for too short a duration
- Placing sensors where they miss actual risk areas
- Starting without a written, approved protocol
Step 1 – Develop and Approve a Written Protocol
GDP regulations require a written, pre-approved protocol before any mapping study begins. The protocol defines:
- Study objectives and scope
- Acceptance criteria (target temperature ranges for each zone)
- Sensor placement rationale with specific locations justified
- Study duration and conditions (loaded vs. empty, seasonal timing)
- Roles and responsibilities
- Deviation-handling procedures
The protocol must specify exact temperature ranges for each storage zone based on product labeling. For example, use 2-8°C for biologics in cold rooms or 15-25°C for oral solid medications in ambient warehouses.
Quality Assurance must review and approve the protocol before execution. Document and justify any deviations that occur during the study.
Step 2 – Select and Calibrate Data Loggers
All temperature sensors must be calibrated before use. WHO Supplement 8 recommends:
- Calibration by an accredited laboratory: ISO/IEC 17025:2017 defines testing and calibration laboratory competence standards; WHO requires NIST-traceable three-point calibration
- Accuracy specification: ±0.5°C or better across the intended measurement range
- Calibration certificates: Must show traceability to national/international standards and remain current for the study period
- Logger specifications: Sufficient memory for 7-14 days at 1-5 minute recording intervals, battery life exceeding study duration, and audit-trail capability for GDP compliance
Before deployment, verify each logger is functional: check battery status, synchronize time/date settings, and confirm the logger will record at the protocol-specified interval.
Step 3 – Place Sensors Strategically Throughout the Warehouse
Sensor placement determines whether the study captures true worst-case conditions or misses critical risk zones.
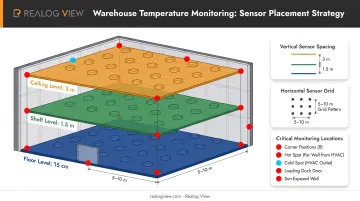
3D Grid Placement Principle
Arrange sensors in a three-dimensional pattern covering length (X-axis), width (Y-axis), and height (Z-axis):
- Horizontal spacing: WHO recommends 5-10 meters apart as a typical grid density, adjusted based on warehouse size and layout
- Vertical levels: Floor (15 cm above ground), mid-height (where products actually sit on shelves or pallets), and ceiling (15 cm below ceiling for warehouses up to 3.6 meters; additional levels for higher spaces)
Minimum Sensor Quantities
WHO bases sensor counts on warehouse volume and risk, not a fixed "sensors per cubic meter" formula. Typical guidance suggests:
- Small storage areas (<50 m³): Minimum 9 sensors
- Medium warehouses (50-200 m³): 15-20 sensors
- Large warehouses (200-500 m³): 20+ sensors, with additional coverage for each 50-100 m³ beyond baseline
Critical High-Risk Locations
Beyond the regular grid, place additional sensors at:
- All eight corners of the space
- Directly under or near HVAC supply air outlets (often coldest locations)
- Farthest points from HVAC equipment (often warmest locations due to poor air circulation)
- Near doors and loading docks (heat infiltration during door openings)
- Against sun-exposed exterior walls (solar heat gain)
- Near any internal heat-generating equipment (compressors, lighting ballasts)
Position sensors at heights that match actual product storage, such as on shelves, on pallets, or at floor level. Keep them off walls and out of direct airflow so readings represent real storage conditions.
Step 4 – Run the Study Under Representative Conditions
Study Duration
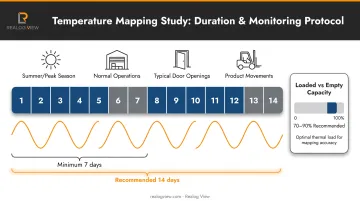
GDP guidelines recommend 7-14 consecutive days of continuous monitoring to capture:
- Daily operational cycles (business hours vs. nights and weekends)
- Door-opening patterns and staff activity
- HVAC system performance variations
- At least five working days plus two weekend days
Cold rooms and freezers not affected by daily cycles may justify shorter studies (24-72 hours), documented in the protocol.
Seasonal Timing
WHO and PIC/S recommend mapping during the most challenging season, typically summer when cooling loads are highest. Facilities with significant seasonal temperature swings should repeat the study in winter to capture full annual variation. Climate-controlled warehouses with minimal seasonal influence may justify single-season mapping with documented rationale.
Loaded vs. Empty Conditions
WHO's qualification objectives include both states:
- Empty mapping: Shows HVAC system baseline performance and air-circulation patterns without obstruction
- Loaded mapping: Shows real-world conditions where stacked product (typically 70-90% capacity) blocks airflow and creates thermal mass
Both provide valuable information, but loaded conditions more accurately represent operational reality.
Normal Operations
The warehouse should operate normally during mapping—typical door openings, product movements, staff activity—to capture realistic conditions rather than idealized shutdown scenarios.
Step 5 – Analyze Data and Identify Hot Spots and Cold Spots
After data collection ends, analyze each sensor's recordings for:
- Maximum temperature (Tmax): Highest reading recorded
- Minimum temperature (Tmin): Lowest reading recorded
- Mean temperature (Tavg): Arithmetic average
- Temperature range: Tmax – Tmin
- Mean Kinetic Temperature (MKT): A weighted average accounting for the exponential effect of high temperatures on drug degradation
Understanding MKT
FDA defines MKT as the single derived temperature that produces the same thermal challenge over a defined period as the actual sequence of higher and lower temperatures. Because chemical reactions follow Arrhenius kinetics, brief high-temperature excursions have a disproportionate impact on pharmaceutical stability. That makes MKT more meaningful than a simple arithmetic average when you assess thermal stress.
MKT cannot normalize or excuse uncontrolled storage that exceeded acceptance criteria. It is an excursion-analysis tool, not a substitute for spatial qualification.
Hot Spot and Cold Spot Identification
- Hot spots: Locations with the highest MKT or maximum temperatures—greatest risk for heat-sensitive products
- Cold spots: Locations with the lowest temperatures—risk of freezing for refrigerated products like vaccines
Compare all results against acceptance criteria defined in the protocol (for example, all areas remain within 2-8°C for cold rooms, and no area exceeds 25°C in ambient zones). Any excursions require investigation and documentation. Temperature contour maps, 3D heat maps, and time-series graphs help visualize patterns and communicate findings to stakeholders.
Step 6 – Document Results and Establish Monitoring Points
A mapping report must include:
- Protocol adherence confirmation
- Sensor calibration certificates with traceability
- Sensor placement diagrams showing 3D coordinates
- Complete temperature data for all sensors across the full study period
- Statistical analysis and acceptance criteria evaluation
- Identified hot spot and cold spot locations with justification
- Recommendations for permanent monitoring sensor placement
- Any deviations, investigations, and corrective actions
Quality Assurance must review and approve the report. Conclusions state whether the facility is qualified for product storage or if corrective actions (HVAC adjustments, layout changes, or insulation improvements) are needed before release.
From Mapping to Monitoring
Mapping results translate directly to operational monitoring strategy:
- Place permanent temperature sensors at identified worst-case locations (hot spot for heat-sensitive products, cold spot for freeze-sensitive items)
- Add sensors based on risk assessment—larger facilities or complex layouts may justify additional monitoring points beyond the bare minimum
- Configure alarm thresholds based on product labeling and mapping results
- Retain the mapping report and all supporting data as permanent quality records subject to regulatory inspection
Temperature Mapping Study – Real-World Example
Scenario: A mid-sized pharmaceutical distributor needs to qualify a 300 m³ ambient warehouse (target 15-25°C) before storing oral solid medications and topical products. The facility recently upgraded its HVAC system but has never been formally mapped under the new configuration.
Protocol Phase
The Quality team writes a protocol for 25 calibrated data loggers under peak summer load:
- 5×5 horizontal grid at three heights: floor (15 cm), mid-shelf (1.5 m), and ceiling (3 m)
- Extra sensors at the four corners, loading dock door, and farthest point from the HVAC unit
- 14-day duration in July, when cooling demand is highest
- Warehouse held at ~75% capacity to reflect normal operations
Execution Phase
Sensors are deployed on a Friday afternoon after calibration verification. Over the two weeks, the warehouse runs normal operations: daily shipments, weekend closures, and one unplanned three-hour power interruption that triggers investigation.
Analysis Findings
Data review shows:
- 23 of 25 sensors remained within 15-25°C throughout the study
- Two sensors near the west-facing wall and loading dock hit 26.8°C and 27.3°C in the afternoon (solar gain and door openings)
- MKT at these hot spots averaged 24.2°C, acceptable for most oral solids but still requiring attention
- The power interruption caused a brief temperature rise to 23.1°C, well within limits and quickly recovered
Outcome and Corrective Actions
The team recommends:
- Adding insulation to the west wall to reduce solar heat transfer
- Installing an air curtain at the loading dock to minimize heat infiltration during door openings
- Placing two permanent monitors at the hot spots, with alarms at 24°C (warning) and 25°C (action)
After these changes, the warehouse is approved for product storage with continuous monitoring at the critical points. Mapping caught the hot spots before product was at risk and gave the team a clear basis for permanent controls.
How Realog View Can Help
Realog View manufactures FDA 21 CFR Part 11-compliant temperature data loggers for pharmaceutical temperature mapping and continuous monitoring. For US-based pharmaceutical companies running warehouse qualification studies, these features map directly to study requirements:
Automatic PDF and CSV Report Generation Without External Software
Realog View loggers connect via USB and instantly generate audit-ready reports with complete data integrity. That removes the complexity and cost of proprietary software systems. Connect the logger to any Windows PC, and formatted documentation appears automatically.
Multi-Use, Reusable Design with User-Replaceable Batteries
Models like TempTrail Display M and Glacial support repeated mapping studies. User-replaceable ½ AA batteries (18-month shelf life) cut per-study costs versus single-use devices. Configurable logging intervals, alarms, and recording durations make periodic re-mapping and seasonal studies more economical.
Wide Temperature Range Coverage Across Product Lines
The combined Realog View portfolio spans -85°C to +140°C:
- TempTrail Glacial: -85°C to +70°C for ultra-low freezers and cryogenic storage
- Standard TempTrail models: -30°C to +70°C for refrigerated and ambient warehouses
- TempTrail HiTemp: +5°C to +140°C for autoclave validation and high-temperature processes
The same logger platform can cover multiple storage zones in a single facility qualification program.
DO-160G Certification and IP67/IP68 Protection
DO-160G certification shows proven durability under extreme environmental testing. IP67 tamper-proof casings (IP68 for HiTemp) protect against dust, moisture, temporary immersion, and physical handling. That keeps data collection reliable in warehouses with cleaning protocols and daily operations.
User-Configurable Parameters
Quality teams can set custom alarm thresholds, recording intervals (as frequent as every 5 seconds on HiTemp), start delays, and measurement units (°C or °F) to match protocol requirements. No vendor dependency for configuration changes.
±0.2°C Accuracy Meeting WHO Recommendations
Standard TempTrail models specify ±0.2°C accuracy with 0.1°C resolution, well within WHO's ±0.5°C recommendation for pharmaceutical mapping. TempTrail Glacial provides ±0.3°C accuracy across its ultra-low range.
FDA 21 CFR Part 11 Compliance Built Into Firmware
Complete data integrity, electronic record security, and audit trails meet regulatory expectations for pharmaceutical applications. That supports GDP documentation requirements and inspection readiness.
For volume pricing on 20-25+ loggers for large mapping studies, or technical consultation on model selection for specific warehouse configurations, contact Realog View at contactus@realogview.com or visit https://realogview.com/contactus/.
Conclusion
Temperature mapping turns storage assumptions into documented evidence. It shows that your facility can hold validated conditions that protect product quality and patient safety before any medication enters the warehouse.
Mapping is not a one-time checkbox. It is an ongoing quality commitment: initial qualification before use, re-mapping after significant changes, and continuous monitoring guided by those results. Together, they form a temperature management system that holds up under regulatory scrutiny.
Temperature-sensitive products such as biologics, mRNA vaccines, and cell therapies only raise the stakes. Pair solid mapping with disciplined monitoring so you catch excursions early, protect supply chain integrity, and avoid costly product loss.
Frequently Asked Questions
How often should pharmaceutical warehouses undergo temperature mapping?
Initial mapping is required before first use. Re-map after significant changes such as HVAC modifications, layout alterations, or equipment failures. WHO cites every three years as one example of periodic re-mapping, but frequency should follow your risk assessment and facility history.
What is the difference between temperature mapping and continuous monitoring?
Mapping is a temporary qualification study (typically 7–14 days) that places many sensors throughout the space to characterize temperature distribution and find hot and cold spots. Continuous monitoring uses permanently installed sensors at the critical locations identified by mapping, providing real-time surveillance 24/7/365.
How many data loggers are needed for warehouse temperature mapping?
Sensor quantity depends on warehouse volume, geometry, and risk factors. WHO recommends 5–10 meter horizontal spacing in a 3D grid. Typical counts are 9 sensors for small spaces (<50 m³), 15–20 for medium warehouses (50–200 m³), and 20+ for large facilities. Add sensors at high-risk spots such as doors, sun-exposed walls, and HVAC dead zones.
What are the most common reasons temperature mapping studies fail?
Common failures include uncalibrated or expired sensors, insufficient study duration, poor sensor placement, no pre-approved written protocol, and skipping worst-case seasonal conditions. Any of these can trigger regulatory rejection or invalid results.
Do I need to map my warehouse in both summer and winter?
WHO and PIC/S recommend mapping in both extreme seasons when facilities see significant seasonal swings: summer for cooling capacity and hot spots, winter for heating performance. Highly climate-controlled sites with minimal seasonal change may justify single-season mapping with Quality-approved rationale.
What is Mean Kinetic Temperature (MKT) and why does it matter?
MKT is a calculated weighted average that accounts for the exponential effect of temperature on drug degradation (Arrhenius kinetics). It is more meaningful than a simple average because brief high-temperature excursions hit stability harder. MKT helps assess thermal stress during excursions but cannot normalize storage that already exceeded acceptance criteria.