While GDP and GMP guidelines frequently reference temperature mapping, the operational details behind execution remain poorly understood beyond compliance checklists. This article explains what the temperature mapping process entails, how studies are executed step-by-step, what variables affect results, and when mapping is required versus optional.
Key Takeaways
- Identify hot/cold spots with 9–25+ calibrated data loggers placed throughout the unit
- Map at OQ/PQ, after major changes, and every 1–3 years based on risk
- Factor in load conditions, seasonal ambient swings, and defrost cycles
- Meet FDA 21 CFR Parts 210/211; use WHO TRS 961 and EU GDP for methods
- Place permanent monitoring sensors at the hot/cold spots mapping finds
What Is the Temperature Mapping Process?
The temperature mapping process is a documented qualification activity. Calibrated data loggers measure temperature at multiple predetermined points inside a refrigerated storage unit over a set period. The goal is to prove the unit maintains required conditions uniformly across all storage zones.
Three Core Outcomes:
- Identify temperature extremes: Locate hot spots (warmest zones) and cold spots (coldest zones or freeze-risk areas)
- Verify range compliance: Prove no storage location falls outside acceptable temperature ranges
- Establish monitoring placement: Provide data-driven evidence for where permanent sensors should sit
How Mapping Differs from Related Activities:
| Activity | Purpose | Measurement Points | Frequency |
|---|---|---|---|
| Temperature Mapping | Validation study to characterize spatial distribution | 9-25+ loggers throughout unit | One-time or periodic (1-3 years) |
| Routine Monitoring | Continuous real-time tracking | 1-2 permanent sensors | Continuous |
| Calibration | Verify measurement accuracy of instruments | Single device under test | Annual or per schedule |
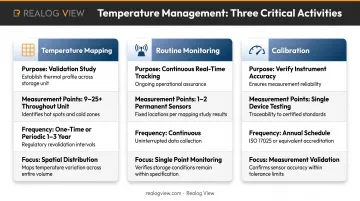
Mapping uses far more measurement points than ongoing monitoring because it captures the full three-dimensional temperature profile of the unit—not a single representative spot.
Why the Temperature Mapping Process Is Used in Refrigerated Storage
Refrigerated pharmaceutical and biological products require consistent 2-8°C storage. Temperature excursions degrade active ingredients, reduce efficacy, and can render products unsafe.
According to the CDC, aluminum-adjuvanted liquid vaccines permanently lose potency if frozen, while frozen varicella-containing vaccines lose potency at warmer-than-recommended temperatures. Those risks are why regulators require temperature mapping before refrigerated storage goes into use.
Regulatory Requirements
- FDA: 21 CFR Parts 210 & 211 require storage controls under written procedures (§211.142) and equipment qualification (§211.68)
- EU GDP: 2013 Guidelines Section 3.2.1 require initial mapping before use, with monitors placed at mapped extremes
- WHO TRS 961: Annex 9 Supplement 8 details logger placement, study duration, and acceptance criteria
Consequences Without Mapping
- Undetected cold spots near cooling coils that freeze vaccines
- Warm zones near doors that accelerate product degradation
- Inadequate monitoring placement that misses excursions
- Regulatory findings during inspections that halt operations
The cost of product loss from undetected temperature failures far exceeds the mapping investment. That is why temperature mapping is an industry best practice even in non-regulated settings.
How the Temperature Mapping Process Works
Temperature mapping places 9–25 calibrated data loggers on a three-dimensional grid inside the refrigerator. Loggers record at 1–15 minute intervals for 24–72 hours under defined conditions.
You then analyze the data for spatial temperature variation and temporal stability.
Core Components:
- Calibrated data loggers with NIST-traceable certificates (±0.5°C accuracy typical)
- Written protocol defining logger placement and acceptance criteria
- Representative load conditions simulating actual product storage
- Documentation of ambient conditions and operational parameters
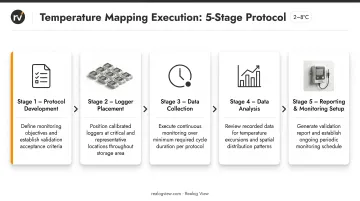
Step 1: Pre-Mapping Preparation and Protocol Development
Write and approve the mapping protocol first. It must define:
- Intended use: temperature range, product types, typical load
- Logger placement strategy: 3D grid showing exact positions
- Test duration: minimum 24-48 hours (longer for large units or seasonal validation)
- Acceptance criteria: temperature range limits, uniformity requirements, recovery time limits
- Stress test scenarios: door opening frequency/duration, power failure simulation if applicable
According to WHO TRS 961, the protocol should include approvals, change history, glossary, rationale, scope, objectives, methodology, report template, and annexes.
Step 2: Logger Calibration, Placement, and Study Initiation
Before placement, verify every data logger has a current calibration certificate. Use three-point NIST-traceable calibration from the past 12 months, at ±0.5°C or better at each point.
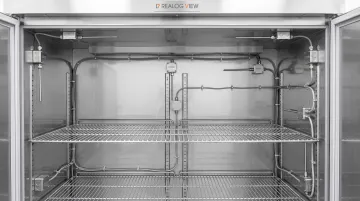
Logger Placement Guidelines:
- Corners (top and bottom)
- Geometric center
- Near door
- Near cooling elements
- Near air return
- Avoid direct contact with walls or shelves (causes false readings from thermal conduction)
Loggers built for this work—such as Realog View TempTrail units (±0.2°C accuracy, automatic PDF/CSV output, FDA 21 CFR Part 11 support)—keep the study traceable without extra software.
After placement, photograph logger positions, sync start times across all devices, and record ambient room temperature plus initial refrigerator conditions.
Step 3: Data Collection Under Representative Conditions
Allow the refrigerator to operate under conditions that simulate actual use:
- Load the unit to representative capacity (empty mapping may be required for OQ, but loaded mapping for PQ is essential)
- Perform normal door openings according to standard operating procedures (frequency and duration documented)
- Ensure complete cooling cycles and defrost cycles if auto-defrost is present
- Record deviations or unusual events during the mapping period
Loggers should run through normal compressor cycles, defrost events, and SOP door openings. According to WHO guidance, test conditions should show both empty and normal-loaded profiles.
Step 4: Data Retrieval, Post-Calibration, and Analysis
After the defined mapping period:
- Retrieve all loggers while verifying positions match protocol (photograph if moved)
- Download data immediately
- Perform post-study calibration check on all loggers
- Analyze data to calculate:
- Overall temperature range (min/max across all points)
- Temperature uniformity (difference between warmest and coldest zones)
- Temporal stability (standard deviation at each point)
- Recovery time after door openings or disturbances
- Defrost cycle temperature spikes if applicable
Step 5: Reporting, Remediation Decisions, and Monitoring Placement
Compile a formal mapping report that includes:
- Approved protocol
- Logger calibration certificates (pre and post)
- Placement diagrams with photos
- Complete raw data sets
- Statistical analysis showing compliance with acceptance criteria
- Identification of hot spots and cold spots
- Deviations and impact assessment
- Conclusions with recommendations
Post-Mapping Actions:
- Establish permanent continuous monitoring sensor locations at identified extreme points (typically hot spot for high alarm, cold spot for low alarm)
- Implement remediation if needed (airflow adjustment, shelf reconfiguration, load limits)
- Document in change control
- Define re-mapping triggers (equipment repair, relocation, configuration change, periodic schedule)
Where the Temperature Mapping Process Is Applied
Temperature mapping applies wherever product integrity depends on proven thermal uniformity—not only upright fridges. The settings below are the most common.
Pharmaceutical and Vaccine Refrigerators
Applications range from small under-counter units (2-10 cu ft) to large pharmacy-grade cabinets (20-50+ cu ft) that store temperature-sensitive drugs, vaccines, biologics, and clinical trial materials. Mapping supports compliance with USP Chapter 1079, FDA requirements, and CDC Vaccine Storage and Handling standards, which specify 2-8°C for refrigerated vaccines.
Realog View's TempTrail Display and Humidity models cover the -30°C to +70°C range with preset alarms and configurable thresholds, so they fit pharmaceutical cold chain mapping work.
Laboratory and Research Cold Storage
Laboratory refrigerators and freezers (-20°C, -80°C) store reagents, samples, cultures, and research materials. Mapping supports CAP accreditation, ISO 17025 compliance, and grant funding requirements.
For ultra-low work, Realog View's TempTrail Glacial models operate from -85°C to +70°C with ±0.3°C accuracy and IP67 rugged casings, which supports cryogenic storage validation.
Walk-in Cold Rooms and Warehouses
Large pharmaceutical and food distribution cold rooms (2-8°C) and frozen storage (-20°C) need extensive mapping. Size, airflow complexity, and loading variability often call for 20-100+ data loggers.
WHO guidance recommends risk-based spacing:
- 5-10 meters between loggers in most facilities
- 20-30 meters in very large spaces when risk assessment allows
Seasonal mapping (summer and winter) is typically required because ambient conditions affect performance.
Cold Chain Transport and Shipping Containers
Refrigerated trucks, air cargo containers, and insulated shipping boxes require mapping under simulated or actual transport conditions. Health Canada GUI-0069 requires mapping when actively temperature-controlled vehicles supply the primary environment. It does not require mapping when qualified insulated packaging alone provides control.
Stability Chambers and Environmental Rooms
Temperature- and humidity-controlled chambers used for stability testing and shelf-life studies need precise mapping because study results feed product labeling. These units often carry tighter uniformity specs than standard storage.
Realog View's TempTrail Humidity & Display models measure 0-100% RH with ±2% RH accuracy alongside temperature, supporting combined temperature and humidity mapping studies.
Key Factors That Affect the Temperature Mapping Process
Several variables decide whether a fridge mapping study catches real risk or produces a false pass. Address each one before you place the first logger.
Logger Placement Strategy
Too few loggers miss localized hot and cold spots. WHO guidance favors risk-based placement over fixed counts by cabinet size.
Place loggers where failure is most likely:
- Airflow extremes: near cooling coils, at air returns, and furthest from circulation fans
- Product zones that represent normal storage locations
- Away from walls and metal surfaces (contact readings reflect conduction, not air temperature)
Load Conditions
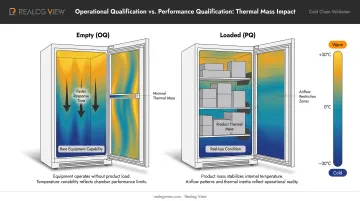
Empty and loaded runs answer different questions:
- Empty (OQ): Larger swings and faster response show bare equipment capability
- Loaded (PQ): Product thermal mass dampens fluctuations, but stock can block airflow and reduce uniformity
Load type changes the result. Solid product, fluid-filled containers, and cardboard packaging each move heat differently, so map with a load that matches real use.
Ambient Environmental Conditions
High room temperature stresses cooling capacity and can expose weak performance. Summer heat versus winter cold can also shift internal distribution patterns.
WHO recommends warmest- and coldest-season studies when ambient season affects the storage area.
Operational Variables
Day-to-day use often drives excursions more than the cabinet design itself:
- Door opening frequency and how long doors stay open
- Defrost cycle timing and spike magnitude
- Power supply stability
- Maintenance condition (dirty condenser coils, low refrigerant, worn door gaskets)
WHO allows no more than 30 minutes outside limits after a door opening, not the 15-minute rule sometimes cited.
Regulatory and Product-Specific Requirements
Pharmaceutical cold chain storage is typically 2-8°C, with tighter or wider limits set by each product’s stability data.
FDA 21 CFR Part 11 requires validated electronic records, accurate copies, protected storage, authorized access, and secure computer-generated, time-stamped audit trails. Those controls shape which data loggers you can use for a compliant study.
Common Issues and Misconceptions
A few common assumptions about fridge temperature mapping create compliance gaps and product risk. These are the ones auditors flag most often.
Assuming Single-Point Monitoring Is Equivalent to Mapping
Many facilities place one temperature probe in a refrigerator and assume it represents the entire unit, but mapping routinely reveals significant variation between zones. That leaves hot and cold spots the single sensor never sees, and product damage goes undetected.
Believing New Equipment Doesn't Require Mapping
WHO guidance explicitly states all new temperature-controlled storage areas must be mapped before commissioning. Purchase cost and age do not guarantee temperature uniformity. Even pharmaceutical-grade refrigerators show meaningful internal variation from design, installation, and day-to-day use.
Confusing Mapping with Calibration
Calibration verifies that a measuring instrument reads accurately. Mapping is a separate, time-limited qualification study that documents temperature distribution across the unit using calibrated data loggers with traceable certificates. Mapping is also not the same as monitoring, which is continuous operational oversight. Uncalibrated loggers produce unreliable data that auditors will reject.
Mapping Only Under Ideal Conditions
Mapping only when ambient conditions are moderate, the door stays closed, and the unit is empty fails to prove the refrigerator can hold temperature under real operating stress. Regulators expect mapping under loaded conditions, with normal door-opening patterns, and ideally across seasonal extremes.
Treating Mapping as One-Time Checkbox
Initial mapping at installation is necessary but not enough. Refrigerators degrade over time through compressor wear, gasket deterioration, and condenser fouling, and repairs or moves change performance. WHO cites every 3 years as an example; EU GDP requires remapping after a risk assessment or any significant change.
When the Temperature Mapping Process May Not Be Appropriate
Temperature mapping is not required in every storage setup. A risk-based review can show when formal studies add little value—or when you should fix the unit before you map it.
Storage of Temperature-Stable Materials
Ambient room-temperature materials (most finished pharmaceutical tablets that do not need refrigeration) and products with wide acceptable ranges (15–30°C) often do not justify formal temperature mapping.
Continuous Monitoring with Sufficient Coverage
When multiple fixed monitors already provide continuous coverage, repeat full mapping may be unnecessary. WHO notes that periodic system re-evaluation can be more appropriate, as long as the ongoing data supports equivalent validation.
Equipment Constraints
Do not map a refrigerator with known maintenance problems. Results will not be reproducible until issues such as these are repaired:
- Compressor failure
- Refrigerant leaks
- Broken door seals
Temporary or portable units moved often between sites with different ambient conditions also cannot be mapped in a way that holds for every future location.
Low-Risk, Non-GxP Environments
Research labs outside regulatory inspection, or small physician offices holding only a few boxes of common vaccines in robust packaging, may rely on basic monitoring and documented temperature logs. Treat that choice as a documented, risk-based decision.
WHO TRS 961 Supplement 8 expressly excludes small-scale refrigerators and freezers from its scope and points users to equipment-appropriate qualification guidance instead.
Conclusion
Temperature mapping proves refrigerated storage units hold required temperatures uniformly across every storage location. In pharmaceutical, biotech, cold chain logistics, and healthcare settings, that record supports regulatory compliance, prevents product loss from undetected failures, and protects patient safety.
How you apply mapping principles matters more than generic protocols:
- Appropriate logger placement
- Representative test conditions
- Proper data analysis
- Risk-based re-mapping schedules
Tailor the strategy to your products, operating patterns, and risk profile—not a generic checklist.
Frequently Asked Questions
What is a temperature mapping device?
A temperature mapping device is a calibrated data logger that records temperature at set intervals. For GxP use, it needs NIST-traceable calibration and typically ±0.5°C accuracy or better. Many modern loggers generate PDF/CSV reports without external software.
What are the FDA guidelines for temperature mapping?
The FDA does not publish a standalone temperature mapping guideline. Mapping is required under equipment qualification in 21 CFR Parts 210 and 211 so storage conditions protect product quality. FDA expectations align with WHO TRS 961 and EU GDP mapping procedures.
How many data loggers are needed for refrigerator mapping?
The number depends on refrigerator size and complexity. WHO recommends risk-based placement: about 9 loggers for small under-counter units and 15–25+ for large cabinets or walk-in cold rooms. Cover corners, center, door areas, cooling elements, and airflow extremes in three-dimensional space.
Should refrigerators be mapped empty or loaded for qualification?
Both empty and loaded mapping are typically required. Empty mapping tests worst-case heat load for operational qualification. Loaded mapping with representative product proves uniform temperature in real use for performance qualification, including when product blocks airflow.
How often should temperature mapping be repeated?
Re-mapping should be risk-based. WHO cites every 3 years as an example, but also re-map after relocation, major repairs, configuration changes, repeated excursions, or seasonal extremes in non-climate-controlled spaces.
Where should continuous monitoring sensors be placed after mapping is complete?
Place permanent sensors at the hot spot (warmest consistent location for high alarms) and cold spot (coldest or freeze-prone area for low alarms). That placement helps the monitoring system catch excursions before they affect most stored product.