Introduction
Temperature mapping is the systematic process of measuring and documenting temperature distribution across cold storage equipment and facilities with multiple calibrated sensors. It confirms that conditions stay uniform where it matters.
For pharmaceutical companies, cold chain logistics teams, vaccine storage facilities, and quality assurance professionals, mapping supports FDA 21 CFR Part 211 and WHO compliance—and protects product integrity and patient safety.
GMP (Good Manufacturing Practice) and GDP (Good Distribution Practice) rules reference temperature mapping often, yet the operational details still get misunderstood. Teams mix up one-time monitoring with full spatial analysis, or place a generic sensor count with no scientific rationale. Those gaps show up as compliance failures in regulatory audits.
This article covers what temperature mapping is, how the process works step by step, which factors affect accuracy, when and where mapping is required, and the misconceptions that leave validation short.
Key Takeaways
- Temperature mapping validates cold storage by documenting spatial temperature distribution with calibrated sensors
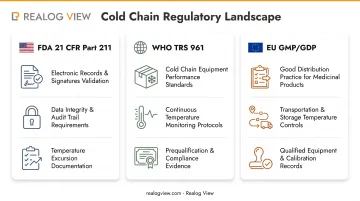
- FDA 21 CFR Part 211, WHO TRS 961, and EU GMP/GDP require documented evidence of product-appropriate temperature ranges
- Freezer mapping runs 24–72 hours (longer for warehouses), then statistical analysis flags hot/cold spots for audit-ready records
- Results hinge on sensor count and placement, load conditions, door openings, ambient temperature, and ISO 17025 logger calibration
What Is Temperature Mapping?
Temperature mapping is a documented qualification process that uses multiple calibrated temperature sensors positioned throughout a storage space. The sensors measure, record, and analyze temperature distribution over time, creating a thermal profile that identifies variations and confirms all zones remain within acceptable limits.
The outcome proves that cold storage equipment maintains uniform, controlled conditions suitable for storing temperature-sensitive products like vaccines, biologics, pharmaceuticals, and biological samples. It also provides documented evidence for regulatory compliance. WHO defines it as "documented measurement of the temperature and/or relative humidity distribution within a storage area, including identification of hot and cold spots."
Mapping vs. Monitoring:
Temperature mapping differs from routine monitoring. Monitoring tracks temperature at one or two fixed points continuously for ongoing compliance.
Mapping is a comprehensive spatial analysis that places multiple sensors temporarily throughout the entire storage volume. This validates the environment initially and after significant changes. EU GDP 2013 requires that monitoring-device locations follow mapping results, particularly covering areas that experience extreme fluctuations.
Two Primary Mapping Types:
- Empty chamber mapping — Performed during operational qualification (OQ) to assess inherent equipment performance without product load or airflow obstruction
- Loaded mapping — Performed during performance qualification (PQ) under actual use conditions with representative product or thermal simulants
Temperature mapping generates statistical data (mean, minimum, maximum, standard deviation) and visual representations such as thermal maps and graphs. These outputs identify hot spots, cold spots, and temperature gradients within the storage space.
What Is a Temperature Mapping Device?
Temperature mapping devices are calibrated data loggers or sensors that record temperature readings at programmed intervals. Most include internal temperature probes, storage for 32,000 data points or more, and wired or wireless data transmission.
Devices must be ISO 17025 calibrated, with certificates traceable to national standards such as NIST, NPL, or PTB. WHO TRS 961 specifies accuracy within ±0.5°C at each calibration point for pharmaceutical applications.
Modern FDA-Compliant Data Loggers:
Modern FDA 21 CFR Part 11 compliant data loggers, such as those from Realog View, generate automatic PDF and CSV reports over USB without external software or probe connections. That setup cuts probe failures, simplifies validation documentation, and reduces mapping study setup errors.
Key Device Specifications for Freezer Mapping:
- Temperature range appropriate for the application (-85°C to +70°C for ultra-low freezers, -30°C to +70°C for standard pharmaceutical storage)
- Recording intervals of 1-15 minutes to capture temperature variations and operational events
- Battery life exceeding study duration (minimum 72 hours for loaded studies)
- Tamper-proof sealed construction with IP67 or IP68 rating for waterproof, submersible operation
Why Temperature Mapping Is Used in Cold Chain
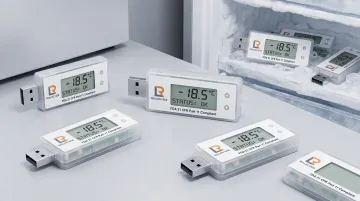
Temperature mapping shows whether every zone in a freezer, cold room, or refrigerated asset stays inside labeled limits—not just the spot next to the control sensor. Regulators expect that proof; product quality depends on it.
Regulatory Drivers
- FDA 21 CFR Part 211.46(b) — Requires adequate temperature and humidity controls when appropriate for manufacturing, processing, packing, or holding drug products
- FDA 21 CFR Part 211.142(b) — Mandates written warehousing procedures for storage under appropriate temperature, humidity, and light so identity, strength, quality, and purity are not affected
- WHO TRS 961 Annex 9, Supplement 8 — States that mapping is required for any space used to store or handle time- and temperature-sensitive pharmaceutical products with a specified labelled storage temperature
- EU GMP Annex 15 — Requires lifecycle qualification from URS (User Requirements Specification) through OQ and PQ, with documented evidence of uniformity
- EU GDP Section 3.3.2 — Requires initial mapping of a storage area before use under representative conditions, including seasonal variation where applicable
Those rules exist because cold chain risk is spatial. A single probe reading “in range” does not mean the top shelf, door plane, or loaded core is.
Cold Chain Demands Addressed by Mapping
- Confirms no storage zone exceeds limits that would degrade product potency
- Shows whether door openings create prolonged warm zones that threaten vaccine stability
- Checks that equipment holds representative product loads without temperature stratification
- Supplies evidence behind shelf-life claims and stability programs
Consequences of Inadequate Mapping
- Vaccines lose potency in warm spots near doors or top shelves
- Frozen biologics take freeze-thaw damage where temperature cycles
- Inspections lead to warning letters and product holds when validation files are thin
- Recalls follow when storage conditions cannot be proven compliant
How Temperature Mapping Works (Conceptual Flow)
Temperature mapping places calibrated sensors throughout a storage space in a grid that captures spatial variation. The equipment then runs under defined conditions (empty or loaded) for 24-72 hours while sensors record temperature continuously.
From that dataset, you identify temperature ranges, hot and cold spots, and how uniform conditions are across the mapped space.
Process Inputs:
- A mapping protocol defining acceptance criteria based on product stability data
- Calibrated data loggers with valid ISO 17025 certificates
- Representative product load or thermal simulants for loaded studies
- Documentation of ambient conditions and equipment settings
- Qualified personnel executing the study according to GMP/GDP requirements
Core Data Collection:
Sensors record temperature at 1-15 minute intervals, capturing normal events such as door openings, defrost cycles, and compressor cycling. Teams document ambient conditions, record protocol deviations with justifications, and preserve raw data with audit trails for integrity.
Process Controls:
- Predefine acceptance criteria from product stability data and regulatory requirements
- Place sensors using risk-based assessment of critical zones (doors, corners, center, top/bottom)
- Run the study long enough to capture at least one full operational cycle
- Follow approved standard operating procedures for every activity
Outcomes and Actions:
- Identify optimal storage zones within the equipment
- Place permanent monitoring sensors at validated hot and cold spots
- Update storage procedures for load limits and door-opening restrictions
- Produce documented evidence for regulatory submissions and audits
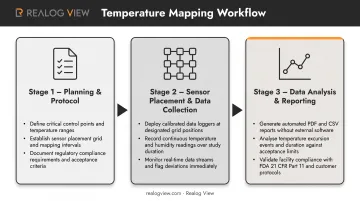
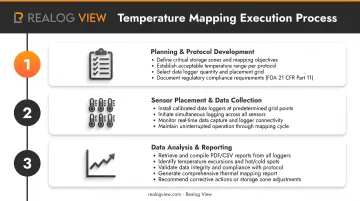
Step 1: Planning and Protocol Development
Develop a temperature mapping protocol that defines:
- Study objective (initial qualification, requalification, or seasonal variation)
- Acceptance criteria based on product requirements
- Sensor quantity and placement strategy (grid-based or risk-based)
- Study duration (minimum 24 hours empty; 48-72 hours loaded)
- Data recording intervals
- Responsibilities for execution and approval
Step 2: Sensor Placement and Data Collection
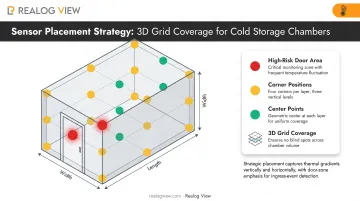
Position calibrated data loggers in a three-dimensional grid covering corners, edges, center, and high-risk zones (door areas, top/bottom shelves). Verify every sensor is recording before the timed study starts.
Document equipment settings (setpoint, alarm limits), ambient conditions, and load configuration. Let the system run undisturbed except for planned operational events while sensors record continuously.
Step 3: Data Analysis and Reporting
After the study ends:
- Retrieve data from all loggers and confirm complete records with no gaps
- Calculate mean, minimum, maximum, and standard deviation for each sensor location
- Create thermal maps or graphs showing temperature distribution and hot/cold spots
- Compare readings against acceptance criteria for pass/fail status
- Document deviations with investigations and corrective actions
- Compile a mapping report (raw data, analysis, conclusions, recommendations) for QA approval
Where Temperature Mapping Is Applied
Temperature mapping is used anywhere product quality depends on proven thermal performance—storage, transport, and controlled lab environments. It shows up across equipment types, at defined points in the asset lifecycle, and when risk or compliance events demand fresh evidence.
Systems and Equipment
Mapping studies commonly cover:
- Ultra-low temperature (ULT) freezers at -80°C for biological samples and cell therapies
- Pharmaceutical freezers at -20°C for vaccines and reagents
- Cold rooms and walk-in freezers for bulk vaccine storage
- Refrigerated warehouses for pharmaceutical distribution
- Temperature-controlled shipping containers for cold chain logistics
- Laboratory incubators that need warm-temperature validation
Lifecycle Points
Run or repeat mapping at these points:
- Initial qualification of newly installed equipment (IQ/OQ/PQ)
- Relocation to a different room or facility
- Major repairs or modifications (compressor replacement, control system upgrades)
- Seasonal studies that capture worst-case ambient conditions
- Periodic requalification on a defined schedule
Typical Triggers
Other events that often force a study:
- Regulatory inspection findings that require validation evidence
- Temperature excursions or alarms that signal equipment problems
- Facility expansion that adds storage capacity
- Product temperature complaints or stability failures
- Portfolio changes that need different storage conditions
- Risk assessments that flag gaps in validation documentation
Key Factors That Affect Temperature Mapping in Cold Chain
Several variables determine whether a mapping study reflects real storage conditions—or leaves gaps auditors will flag. Address each factor below before you run the study.
Sensor Quantity and Placement
Insufficient sensors create blind spots where temperature swings go undetected. WHO TRS 961 recommends a layout that covers both floor area and height:
- Sensors every 5–10 meters in large warehouse spaces
- Vertical arrays at low, middle, and high levels
- Extra points at corners, door areas, and the center (worst-case zones)
Three-dimensional grid coverage also reveals vertical stratification common in freezers.
Equipment Load Conditions
Empty-chamber mapping shows inherent equipment performance, but it does not reflect actual use. Loaded mapping with representative product mass—or thermal simulants—exposes recovery rates and airflow obstruction.
Load-related failures only show up in loaded studies:
- Overloading that restricts air circulation and creates hot spots
- Blocked vents or poor spacing between product
Operational Events and Door Openings
Frequent door access pulls in warm air, causing spikes and slower recovery. Door-opening studies during mapping show that impact under real workflows.
Duration matters: a 30-second open differs sharply from five minutes. WHO guidance expects temperature to stay within defined limits except for a maximum of 30 minutes after opening.
Ambient Temperature and Seasonal Variations
External temperature affects freezer performance, especially in non-climate-controlled areas. Summer mapping captures worst-case heat load on refrigeration systems.
WHO TRS 961 notes that where seasonal variation affects a storage area, at least two studies may be needed—typically one in the warmest season and one in the coldest.
Data Logger Calibration and Accuracy
Expired calibration certificates can invalidate mapping data in a regulatory audit. Before every study, confirm:
- Calibration by an ISO 17025 accredited lab, traceable to national standards
- Range that includes the target temperature (-80°C for ULT freezers, -20°C for standard freezers)
- Measurement uncertainty built into acceptance criteria so minor sensor error does not trigger false failures
Equipment Maintenance and Age
Older units often show wider variation from worn gaskets, refrigerant leaks, or compressor wear. Recent service—coil cleaning or gasket replacement—can restore uniformity.
Auto-defrost cycles cause periodic temperature rises that mapping must capture. Use results as a performance baseline so you can trend the unit over its lifecycle and spot failure risk early.
Common Issues and Misconceptions
Temperature mapping fails more often from process mistakes than from weak equipment. These four misconceptions show up repeatedly in cold chain validation work.
Confusion Between Mapping and Monitoring
Many teams treat continuous monitoring with one or two sensors as full validation. That is not enough. Mapping uses multiple temporary sensors for a spatial study that proves uniformity across the chamber. Monitoring then checks compliance at the locations mapping already validated.
Oversimplification of Sensor Placement
One sensor per shelf—or only the manufacturer's probe locations—misses real variation within shelves and compartments. Risk-based placement focuses on high-variability zones (doors, corners, center). That approach catches hot and cold spots a uniform grid can miss.
Misinterpretation of Acceptance Criteria
Teams sometimes set overly tight limits (±1°C) that product stability data do not support, which drives unnecessary failures. Overly broad criteria (±10°C) leave products unprotected.
Sound limits balance three factors:
- Product protection requirements from labeling and stability data
- What the equipment can actually hold
- Statistical measurement uncertainty
No universal ±3°C rule exists. Limits must come from the product, not habit.
Incorrect Assumptions About Mapping Frequency
One-time mapping at installation is not permanent validation. Performance drifts as equipment ages and seasonal conditions change.
WHO's 2022 vaccine guidance calls for mapping vaccine cold rooms and freezer rooms every two years. Remap sooner when you see:
- Equipment moves
- Major repairs
- Persistent temperature alarms
When Temperature Mapping May Not Be Appropriate
Situations Where Simplified Monitoring Suffices
Small domestic-style refrigerators storing non-critical research samples with minimal regulatory requirements may not justify full mapping costs. Continuous monitoring with sensors at hot and cold spots identified through risk assessment provides adequate control.
Simplified IQ/OQ documentation without extensive spatial mapping meets local quality system needs for low-risk applications.
Cases Where Alternative Approaches Are Better
Full spatial mapping is not always the best fit. These situations often call for a different approach:
- Equipment with daily access and highly variable loads (such as sample retrieval freezers) benefits more from continuous monitoring with real-time alerts than from periodic static mapping
- Very small chambers (benchtop freezers under 1 cubic foot), where single-point monitoring adequately represents the entire volume
- Product-specific monitoring with loggers placed inside product containers, which can provide more relevant validation than chamber mapping alone
Conclusion
Temperature mapping is a systematic validation process that uses multiple calibrated sensors to document temperature distribution throughout cold storage equipment. It proves uniform conditions that protect temperature-sensitive pharmaceuticals, vaccines, and biologics from degradation. Proper execution covers sensor quantity and placement, study duration and load conditions, data analysis that identifies hot and cold spots, and documentation that meets FDA, WHO, and GMP requirements. Done well, mapping secures both regulatory compliance and product integrity for cold chain operations. Successful temperature mapping rests on three practices:
- Follow documented protocols tied to product risk and regulatory requirements rather than generic approaches
- Use properly calibrated FDA 21 CFR Part 11-compliant data loggers with integrated sensors that generate automatic PDF reports
- Maintain validation across the equipment lifecycle through periodic remapping and continuous monitoring at validated locations
Frequently Asked Questions
How do you perform temperature mapping?
Develop a protocol with acceptance criteria, then place calibrated data loggers in a grid throughout the storage space (typically 9-20 sensors). Run the equipment for 24-72 hours while recording continuously, and analyze the data to find hot/cold spots and confirm every zone stays within limits.
How often should a freezer temperature be monitored?
Monitor validated hot and cold spots continuously—typically every 5-15 minutes—with immediate alarms on any excursion. Full temperature mapping is done at initial qualification and then on a risk-based schedule; WHO vaccine guidance recommends every two years.
What are the FDA and ISO guidelines for temperature mapping?
FDA 21 CFR Part 211 requires adequate temperature controls with documented evidence. WHO TRS 961 covers mapping procedures, sensor placement, and study duration, while ISO 17025 sets calibration requirements for measuring equipment. EU GMP Annex 15 and ISPE guides add detailed qualification steps.
How can I monitor my freezer temperature remotely?
Wireless data loggers can send real-time temperature data to cloud dashboards or mobile apps. Automatic SMS or email alerts when limits are exceeded let you respond to excursions from anywhere.
What is a temperature mapping device?
Temperature mapping devices are calibrated data loggers that record temperature at set intervals. Specs to look for include ISO 17025 calibration, tamper-proof IP67/IP68 design, 72+ hours of battery life, and FDA 21 CFR Part 11 compliance for data integrity.
How long should a temperature mapping study run?
Empty chamber studies need at least 24 hours; loaded studies under actual use typically run 48-72 hours. Extend the run to capture a full defrost cycle on auto-defrost units, and account for seasonal ambient swings when those affect the space.